
Random Distributions
Correctly called random variable, these random variable are usefull in hyperparameter tuning.
For each hyperparmeter, a range can be defined, that is, a statistical distribution, which makes the hyperparameter a random variable. This random variable will defined what value the hyperparameter is likely to take.
Let’s explore the hyperparameter distributions, by plotting the following graph : - Probability distribution function (pdf) or probability mass function (pmf) - Cumulative distribution function (cdf) - Histogram of sampling.
Plotting Each Hyperparameter Distribution
Let’s import plotting functions, and neuraxle hyperparameter classes.
[1]:
from neuraxle.hyperparams.distributions import *
from neuraxle.hyperparams.space import HyperparameterSpace
from neuraxle.plotting import plot_histogram, plot_pdf_cdf, plot_distribution_space
import matplotlib.pyplot as plt
import numpy as np
%matplotlib inline

DISCRETE_NUM_BINS = 40
CONTINUOUS_NUM_BINS = 1000
NUM_TRIALS = 100000
X_DOMAIN = np.array(range(-100, 600)) / 100
Discrete Distributions
Here are now the discrete standard distributions, which sample discrete value or categories.
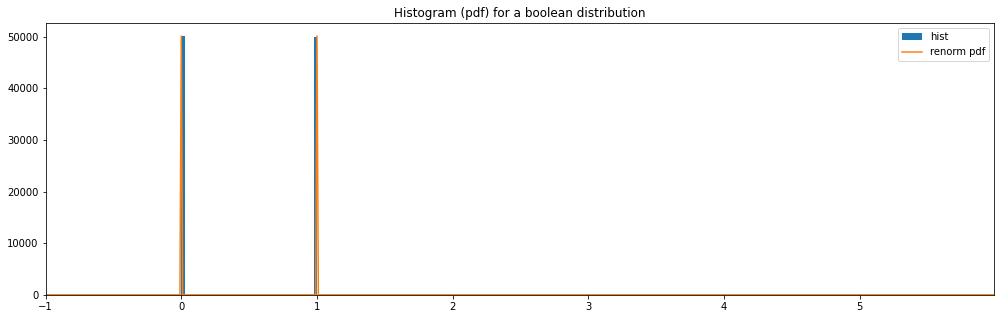
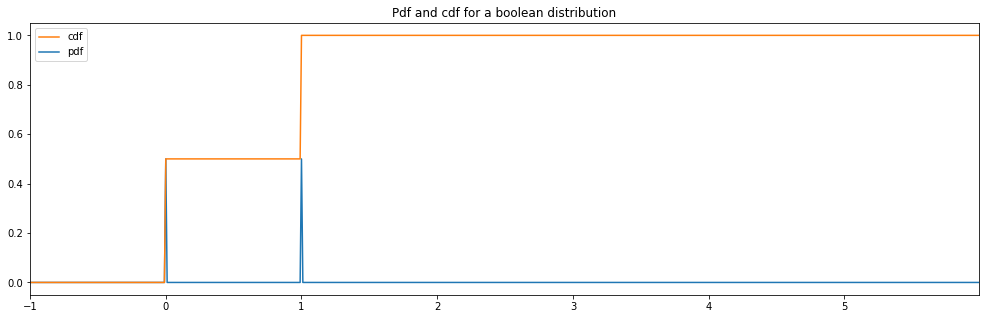
For example, Boolean distribution gives either true or false.
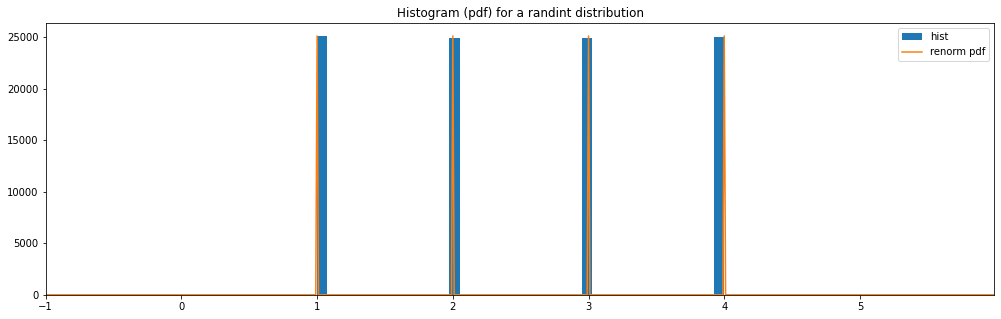
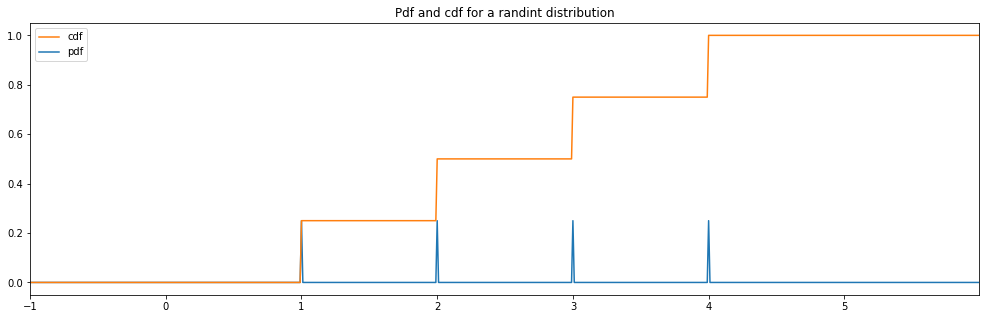
RandInt
[2]:
discrete_hyperparameter_space = HyperparameterSpace({
    "randint": RandInt(1, 4)
})

plot_distribution_space(discrete_hyperparameter_space, num_bins=DISCRETE_NUM_BINS)
randint:
Boolean
[3]:
discrete_hyperparameter_space = HyperparameterSpace({
    "boolean": Boolean()
})
plot_distribution_space(discrete_hyperparameter_space, num_bins=DISCRETE_NUM_BINS)
boolean:
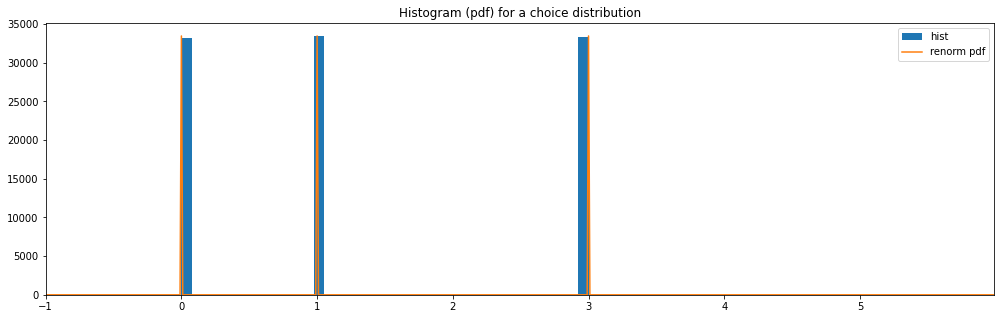
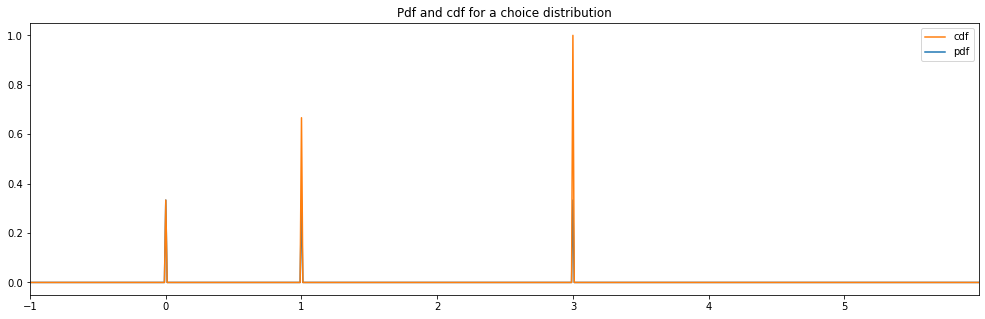
Choice
[4]:
discrete_hyperparameter_space = HyperparameterSpace({
    "choice": Choice([0, 1, 3])
})
plot_distribution_space(discrete_hyperparameter_space, num_bins=DISCRETE_NUM_BINS)
choice:
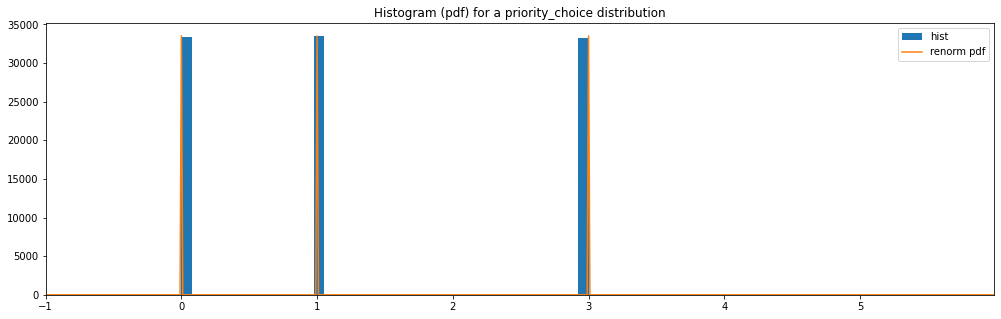
Priority Choice
[5]:
discrete_hyperparameter_space = HyperparameterSpace({
    "priority_choice": PriorityChoice([0, 1, 3])
})
plot_distribution_space(discrete_hyperparameter_space, num_bins=DISCRETE_NUM_BINS)
priority_choice:

Continuous Distributions
Here are now the continuous distributions, which sample a continuous range of values. Those are probably the ones you’ll most use.
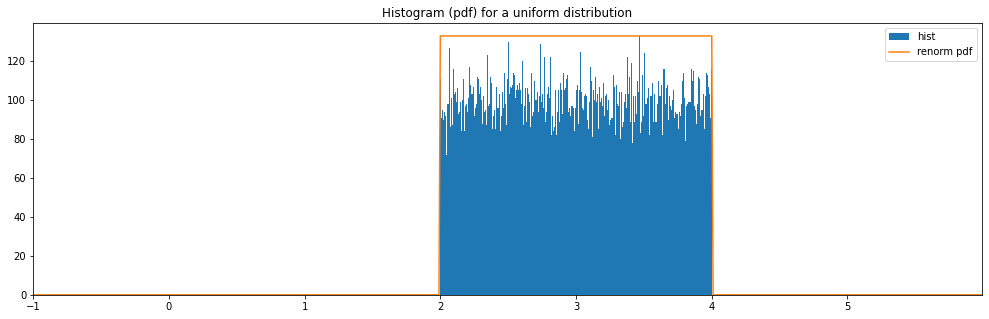
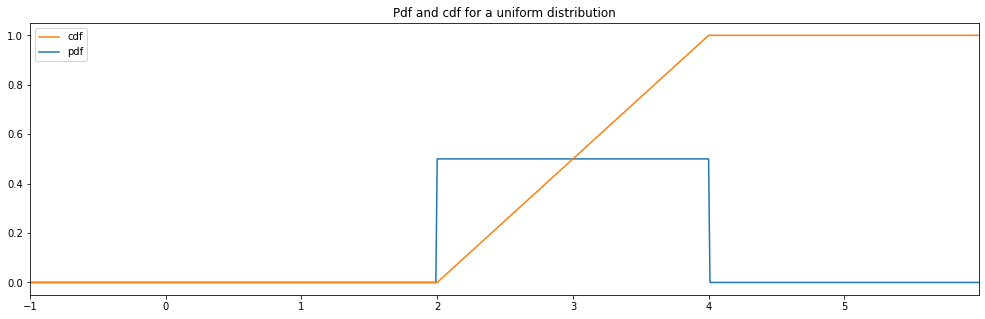
Continuous Uniform
[6]:
continuous_hyperparameter_space = HyperparameterSpace({
    "uniform": Uniform(2., 4.)
})
plot_distribution_space(continuous_hyperparameter_space, num_bins=CONTINUOUS_NUM_BINS)
uniform:
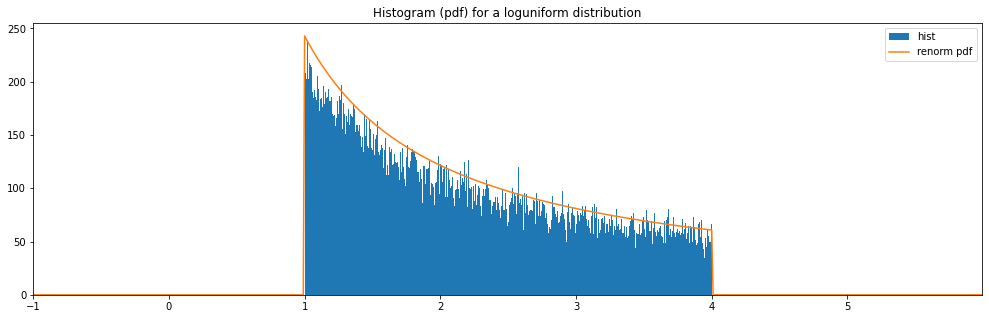
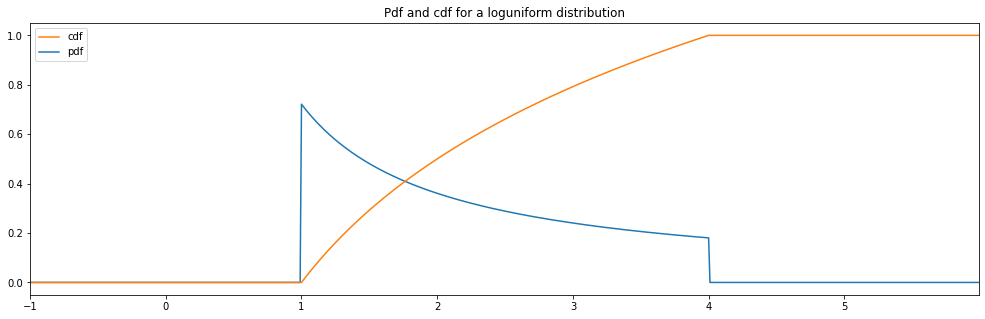
Continuous Loguniform
[7]:
continuous_hyperparameter_space = HyperparameterSpace({
    "loguniform": LogUniform(1., 4.)
})
plot_distribution_space(continuous_hyperparameter_space, num_bins=CONTINUOUS_NUM_BINS)
loguniform:
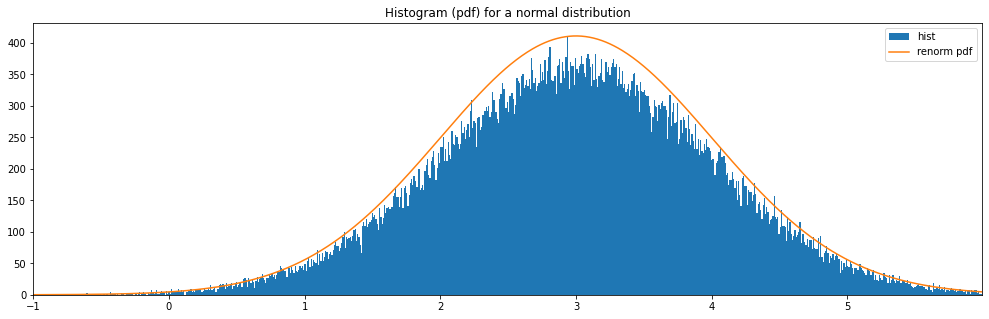
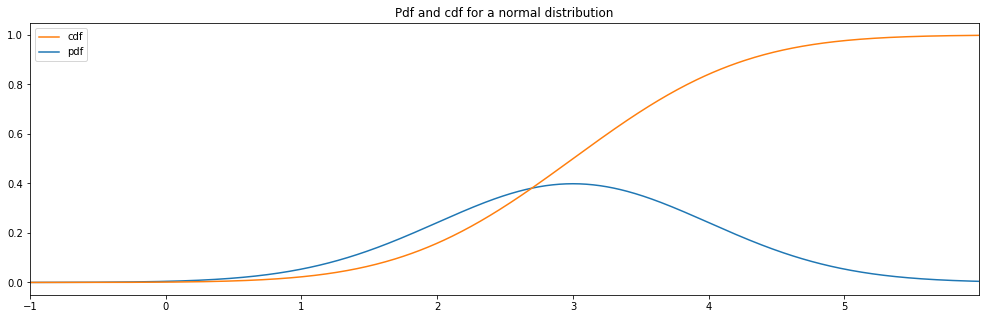
Continuous Normal
[8]:
continuous_hyperparameter_space = HyperparameterSpace({
    "normal": Normal(3.0, 1.0)
})
plot_distribution_space(continuous_hyperparameter_space, num_bins=CONTINUOUS_NUM_BINS)
normal:
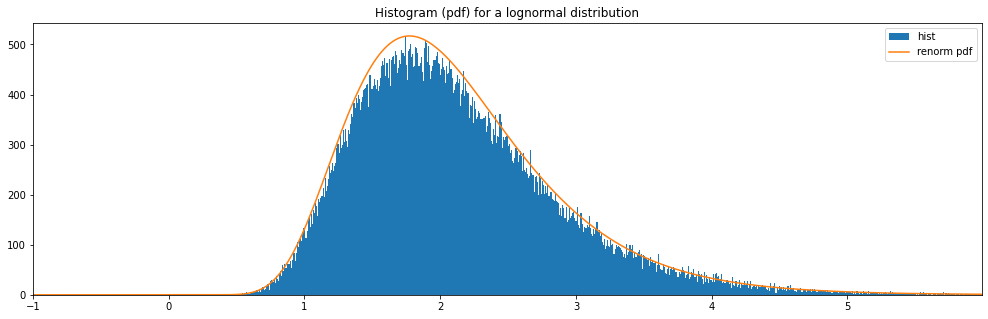
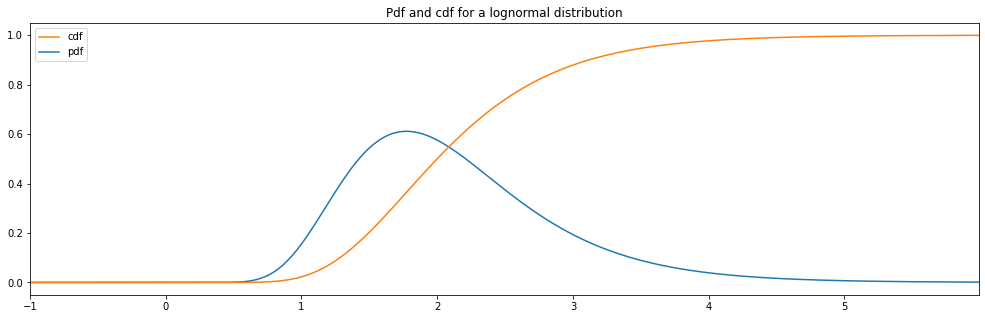
Continuous Lognormal
[9]:
continuous_hyperparameter_space = HyperparameterSpace({
    "lognormal": LogNormal(1.0, 0.5)
})
plot_distribution_space(continuous_hyperparameter_space, num_bins=CONTINUOUS_NUM_BINS)
lognormal:
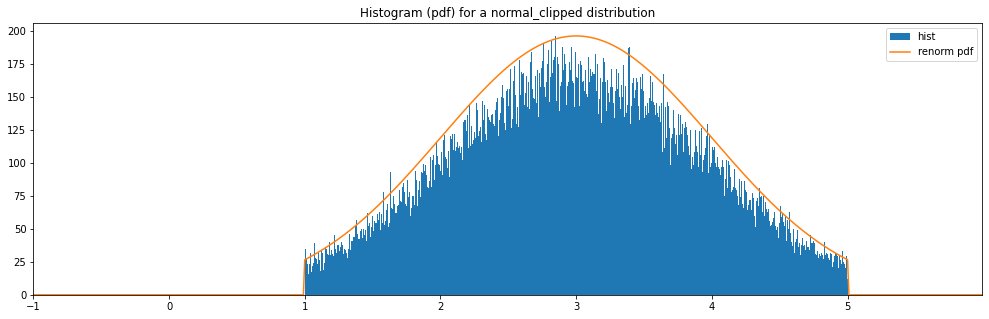
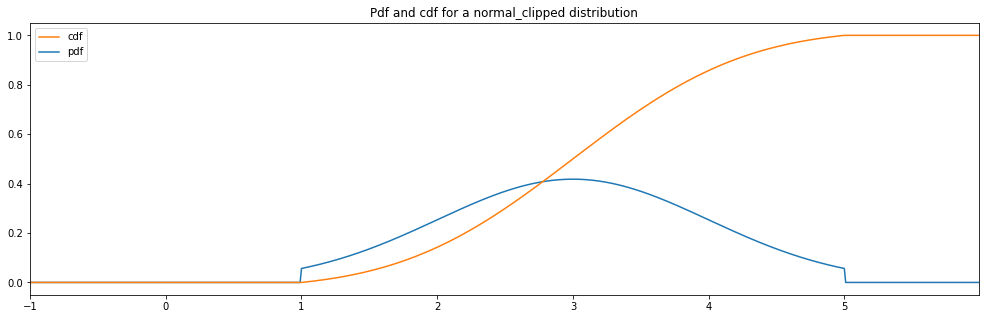
Continuous Normal Clipped
[10]:
continuous_hyperparameter_space = HyperparameterSpace({
    "normal_clipped": Normal(3.0, 1.0, hard_clip_min=1., hard_clip_max=5.)
})
plot_distribution_space(continuous_hyperparameter_space, num_bins=CONTINUOUS_NUM_BINS)
normal_clipped:
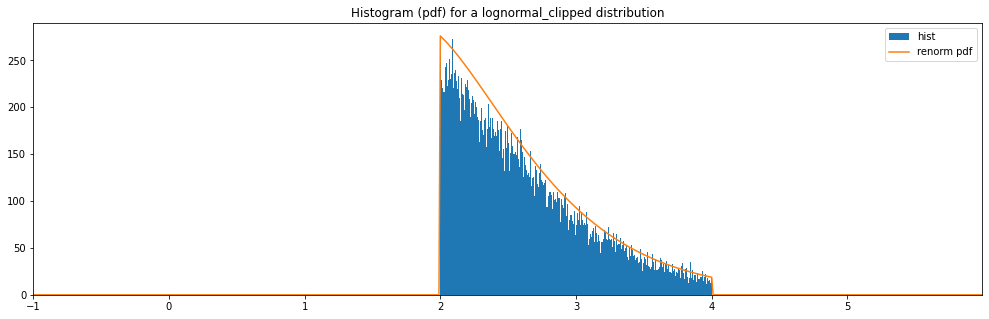
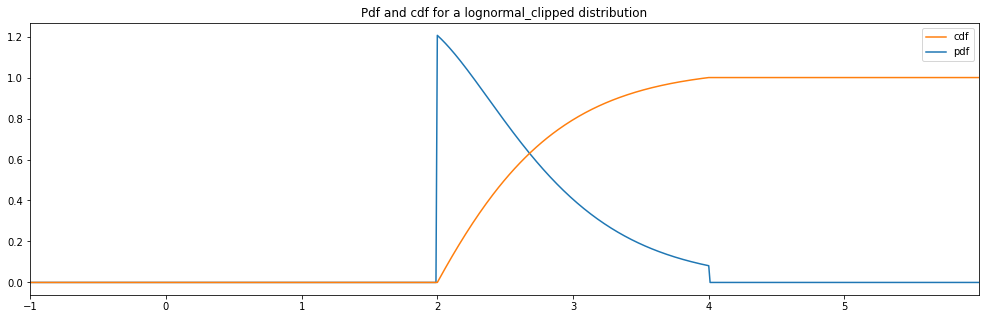
Continuous Lognormal Clipped
[11]:
continuous_hyperparameter_space = HyperparameterSpace({
    "lognormal_clipped": LogNormal(1.0, 0.5, hard_clip_min=2., hard_clip_max=4.)
})
plot_distribution_space(continuous_hyperparameter_space, num_bins=CONTINUOUS_NUM_BINS)
lognormal_clipped:
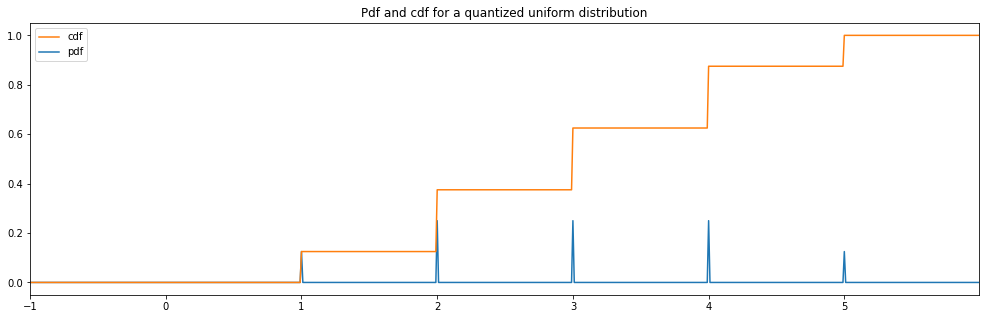
Quantized Hyperparameter Distributions
Here are now the quantized hyperparameter distributions. Those are distributions that yield integers or other precise specific values.
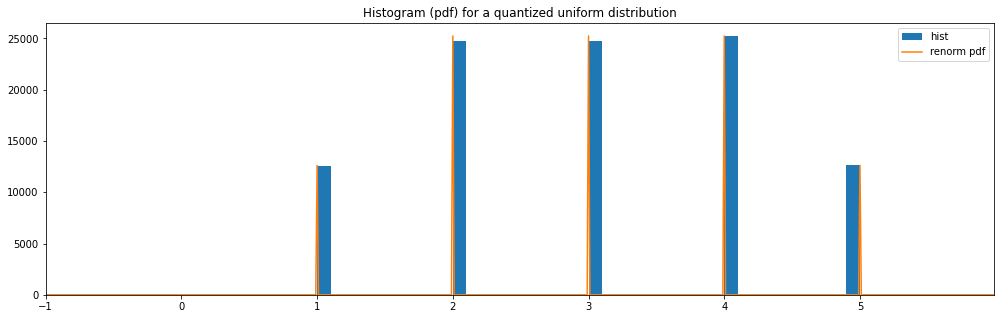
Also, notice how there are border effects to the left and right of the charts when we use
Quantized(...)as a distribution wrapper to round the numbers.Those weird border effect wouldn’t appear if you’d limit the distribution to half numbers instead of plain number.
Let’s say you have a
Quantized(Uniform(-10, 10)): then the samples from approximately -9.5 to -8.5 are rounded toThe bin of the number -9, but the values from -10 to -9.5 are rounder to the bin -10 and a half is missing, so the -10
bin sees its values sampled half as often as -9. That explains the border effect, and you could fix it easily by taking the uniform range from -10.49999 to 10.49999.
Quantized Uniform
[12]:
quantized_hyperparameter_space = HyperparameterSpace({
    "quantized uniform": Quantized(Uniform(1., 5.))
})
plot_distribution_space(quantized_hyperparameter_space, num_bins=DISCRETE_NUM_BINS)
quantized uniform:
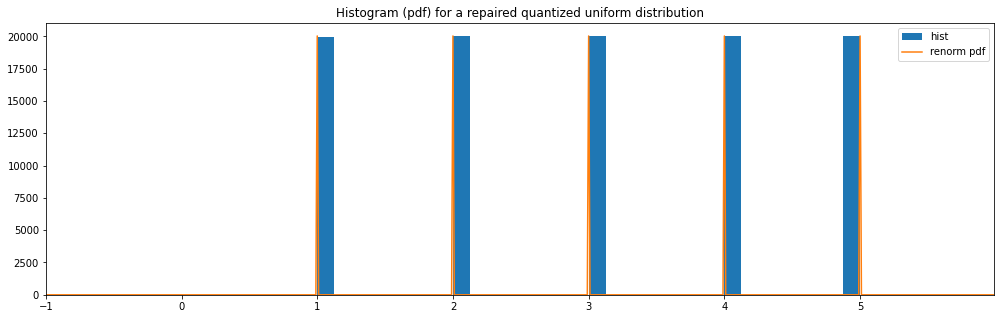
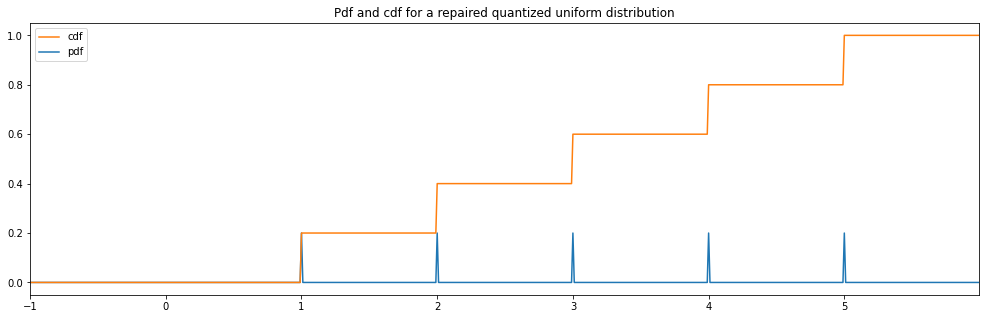
Repaired Quantized Uniform
[13]:
quantized_hyperparameter_space = HyperparameterSpace({
    "repaired quantized uniform": Quantized(Uniform(0.49999, 5.49999))
})

plot_distribution_space(quantized_hyperparameter_space, num_bins=DISCRETE_NUM_BINS)
repaired quantized uniform:
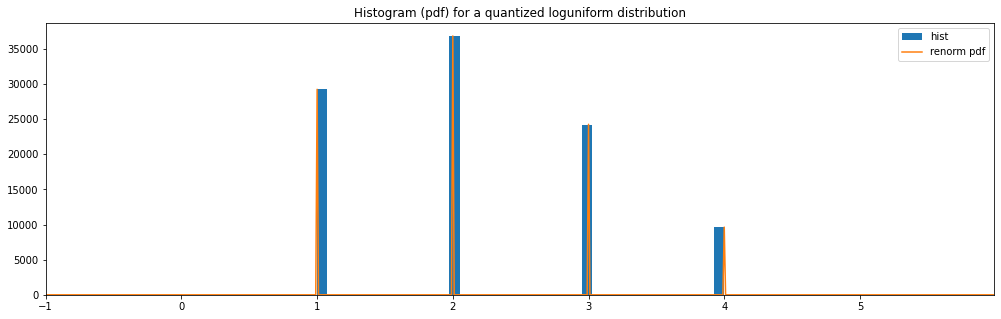
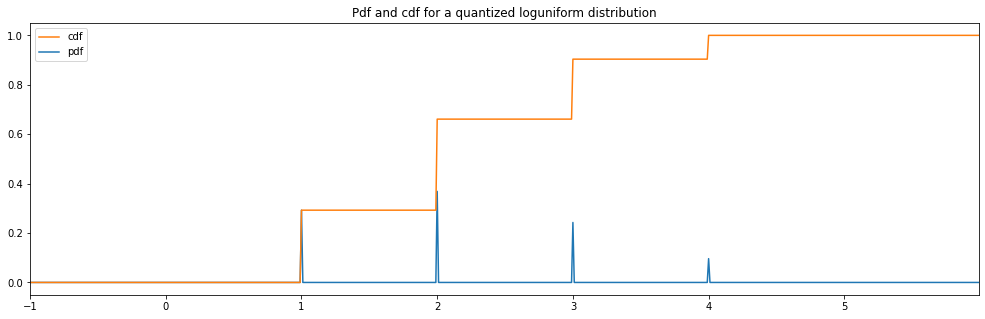
Quantized Log Uniform
[14]:
quantized_hyperparameter_space = HyperparameterSpace({
    "quantized loguniform": Quantized(LogUniform(1.0, 4.0))
})

plot_distribution_space(quantized_hyperparameter_space, num_bins=DISCRETE_NUM_BINS)
quantized loguniform:
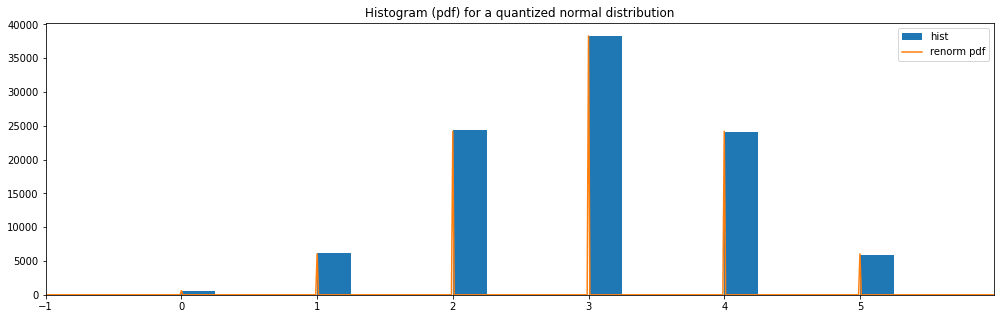
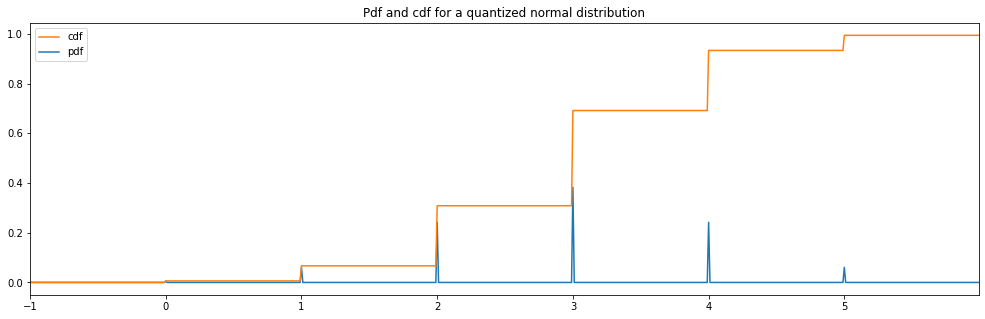
Quantized Normal
[15]:
quantized_hyperparameter_space = HyperparameterSpace({
    "quantized normal": Quantized(Normal(3.0, 1.0))
})

plot_distribution_space(quantized_hyperparameter_space, num_bins=DISCRETE_NUM_BINS)
quantized normal:
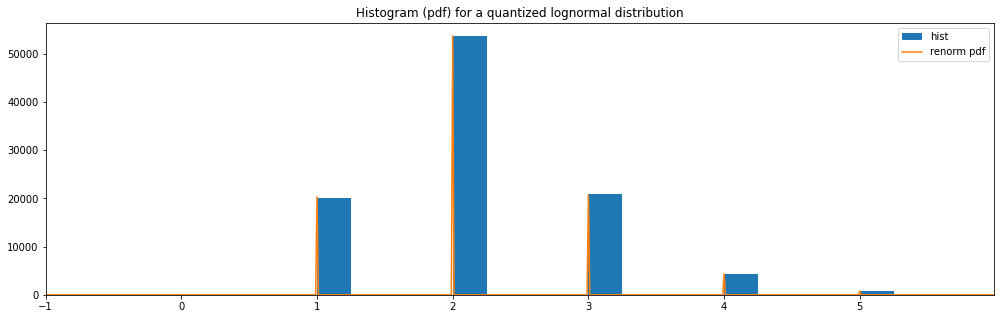
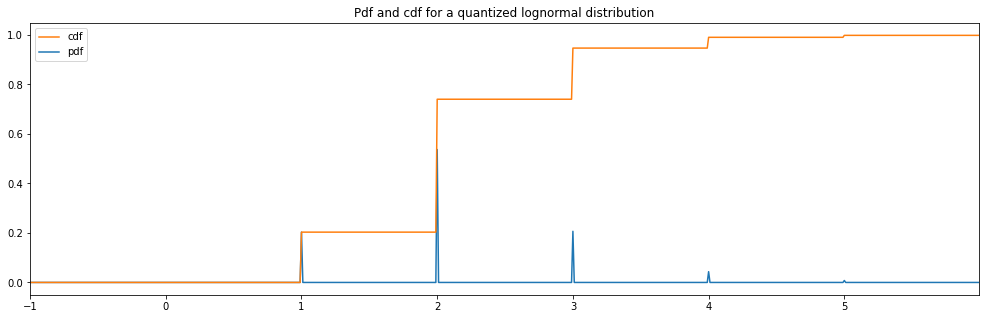
Quantized Lognormal
[16]:
quantized_hyperparameter_space = HyperparameterSpace({
    "quantized lognormal": Quantized(LogNormal(1.0, 0.5))
})
plot_distribution_space(quantized_hyperparameter_space, num_bins=DISCRETE_NUM_BINS)
quantized lognormal:
Creating your own distributions
Why would we limit our users to use just the pre-made distributions?! It’s easier than it looks! Here is for example how the RandInt distribution is coded:
[17]:
class RandInt(DiscreteHyperparameterDistribution):
    """Get a random integer within a range"""

    def __init__(self, min_included: int, max_included: int, null_default_value: int = None):
        """
        Create a quantized random uniform distribution.
        A random integer between the two values inclusively will be returned.

        :param min_included: minimum integer, included.
        :param max_included: maximum integer, included.
        :param null_default_value: null default value for distribution. if None, take the min_included
        :type null_default_value: int
        """
        if null_default_value is None:
            DiscreteHyperparameterDistribution.__init__(self, min_included)
        else:
            DiscreteHyperparameterDistribution.__init__(self, null_default_value)

        self.min_included = min_included
        self.max_included = max_included

    def probabilities(self):
        values = self.values()
        return [1 / len(values) for _ in values]

    def values(self):
        return [i for i in range(self.min_included, self.max_included + 1)]

    def rvs(self) -> int:
        """
        Will return an integer in the specified range as specified at creation.

        :return: an integer.
        """
        return random.randint(self.min_included, self.max_included)

    def pdf(self, x) -> float:
        """
        Calculate the random int mass function value at position `x`.
        :param x: value where the probability mass function is evaluated.
        :return: value of the probability mass function.
        """

        possible_values = set(range(self.min_included, self.max_included + 1))
        if (isinstance(x, int) or x.is_integer()) and x in possible_values:
            return 1 / (self.max_included - self.min_included + 1)

        return 0.

    def cdf(self, x) -> float:
        """
        Calculate the random int cumulative distribution function value at position `x`.
        :param x: value where the cumulative distribution function is evaluated.
        :return: value of the cumulative distribution function.
        """
        if x < self.min_included:
            return 0.

        if x > self.max_included:
            return 1.

        return (math.floor(x) - self.min_included + 1) / (self.max_included - self.min_included + 1)

    def min(self):
        """
        Calculate minimum value that can be sampled in the randint distribution.

        :return: minimal value return from distribution.
        """
        return self.min_included

    def max(self):
        """
        Calculate maximal value that can be sampled in the randint distribution.

        :return: maximal value return from distribution.
        """
        return self.max_included

    def mean(self):
        """
        Calculate mean value (also called esperance) of the random variable.

        :return: mean value of the random variable.
        """
        return (self.max_included + self.min_included) / 2

    def var(self):
        """
        Calculate variance value of the random variable.

        :return: variance value of the random variable.
        """
        return ((self.max_included - self.min_included + 1) ** 2 - 1) / 12
Using Scipy Distributions
Scipy distributions are directly compatible with neuraxle ! Feel free to use them inside your hyperparameter spaces.
[18]:
from neuraxle.base import Identity
from scipy.stats import norm, randint, gamma, uniform

hyperparams_space = HyperparameterSpace({
   'rand_int_scipy': randint(low=2, high=5),
   'gamma_scipy': gamma(0.2),
   'uniform_scipy': uniform(0, 10)
})

print(hyperparams_space.rvs())
HyperparameterSamples([('rand_int_scipy', <scipy.stats._distn_infrastructure.rv_frozen object at 0x7fe8f3f3e290>), ('gamma_scipy', <scipy.stats._distn_infrastructure.rv_frozen object at 0x7fe8f2b28410>), ('uniform_scipy', <scipy.stats._distn_infrastructure.rv_frozen object at 0x7fe8f3f3e950>)])
Creating your own distributions using scipy
You can also use scipy BaseCustomContinuousScipyDistribution, and BaseCustomDiscreteScipyDistribution to avoid a lot of boilerplate code like min, max, mean, and var methods.
BaseCustomContinuousScipyDistribution
[19]:
from neuraxle.hyperparams.scipy_distributions import BaseCustomContinuousScipyDistribution, BaseCustomDiscreteScipyDistribution

class Normal(BaseCustomContinuousScipyDistribution):
    """
    Normal distribution that wraps a `continuous scipy distribution <https://docs.scipy.org/doc/scipy/reference/generated/scipy.stats.rv_continuous.html#scipy.stats.rv_continuous>`_
    """

    def __init__(
            self,
            mean: float,
            std: float,
            hard_clip_min: float = None,
            hard_clip_max: float = None,
            null_default_value: float = None
    ):
        super().__init__(
            name='normal',
            min_included=hard_clip_min,
            max_included=hard_clip_max,
            null_default_value=null_default_value
        )

        self.hard_clip_min = hard_clip_min
        self.hard_clip_max = hard_clip_max
        self.mean = mean
        self.std = std

    def _pdf(self, x) -> float:
        """
        Calculate the Normal probability distribution value at position `x`.
        :param x: value where the probability distribution function is evaluated.
        :return: value of the probability distribution function.
        """

        if self.hard_clip_min is not None and (x < self.hard_clip_min):
            return 0.

        if self.hard_clip_max is not None and (x > self.hard_clip_max):
            return 0.

        if self.hard_clip_min is not None or self.hard_clip_max is not None:
            a = -np.inf
            b = np.inf

            if self.hard_clip_min is not None:
                a = (self.hard_clip_min - self.mean) / self.std

            if self.hard_clip_max is not None:
                b = (self.hard_clip_max - self.mean) / self.std

            return truncnorm.pdf(x, a=a, b=b, loc=self.mean, scale=self.std)

        return norm.pdf(x, loc=self.mean, scale=self.std)
[20]:
hyperparameter_space = HyperparameterSpace({
    "normal": Normal(mean=0.0, std=2.0, hard_clip_min=-3.0, hard_clip_max=3.0)
})
print(hyperparameter_space.rvs())
HyperparameterSamples([('normal', -1.4669749077021386)])
BaseCustomDiscreteScipyDistribution
[21]:
from scipy.special import factorial


class Poisson(BaseCustomDiscreteScipyDistribution):
    """
    Poisson distribution that inherits from `scipy.stats.rv_discrete <https://docs.scipy.org/doc/scipy/reference/generated/scipy.stats.rv_histogram.html#scipy.stats.rv_histogram>`_
    """

    def __init__(self, min_included: float, max_included: float, null_default_value: float = None, mu=0.6):
        super().__init__(
            min_included=min_included,
            max_included=max_included,
            name='poisson',
            null_default_value=null_default_value
        )
        self.mu = mu

    def _pmf(self, x):
        return math.exp(-self.mu) * self.mu ** x / factorial(x)
[26]:
hyperparameter_space = HyperparameterSpace({
    "poisson": Poisson(0.0, 10.0)
})
print(hyperparameter_space.rvs())
HyperparameterSamples([('poisson', 2)])